What Do P50 and P90 Mean on Your Solar Proposal?
Your solar installer presents a proposal: "Your 8 kWp system will generate 10,400 kWh per year." The number looks precise. It was calculated by software. It has decimal points. It must be accurate, right?
Not quite. That number is almost certainly a P50 estimate — and understanding what that means is the difference between realistic expectations and a frustrating first year of solar ownership.
This guide explains P50 and P90 solar energy estimates in plain language, shows you how they affect your payback calculations, and gives you the exact questions to ask your installer so you can make decisions based on realistic numbers rather than best-case scenarios.
P50 and P90: The Simple Explanation
P50 and P90 are probabilistic estimates of how much energy your solar system will produce in a given year. They come from statistical analysis, not guesswork.
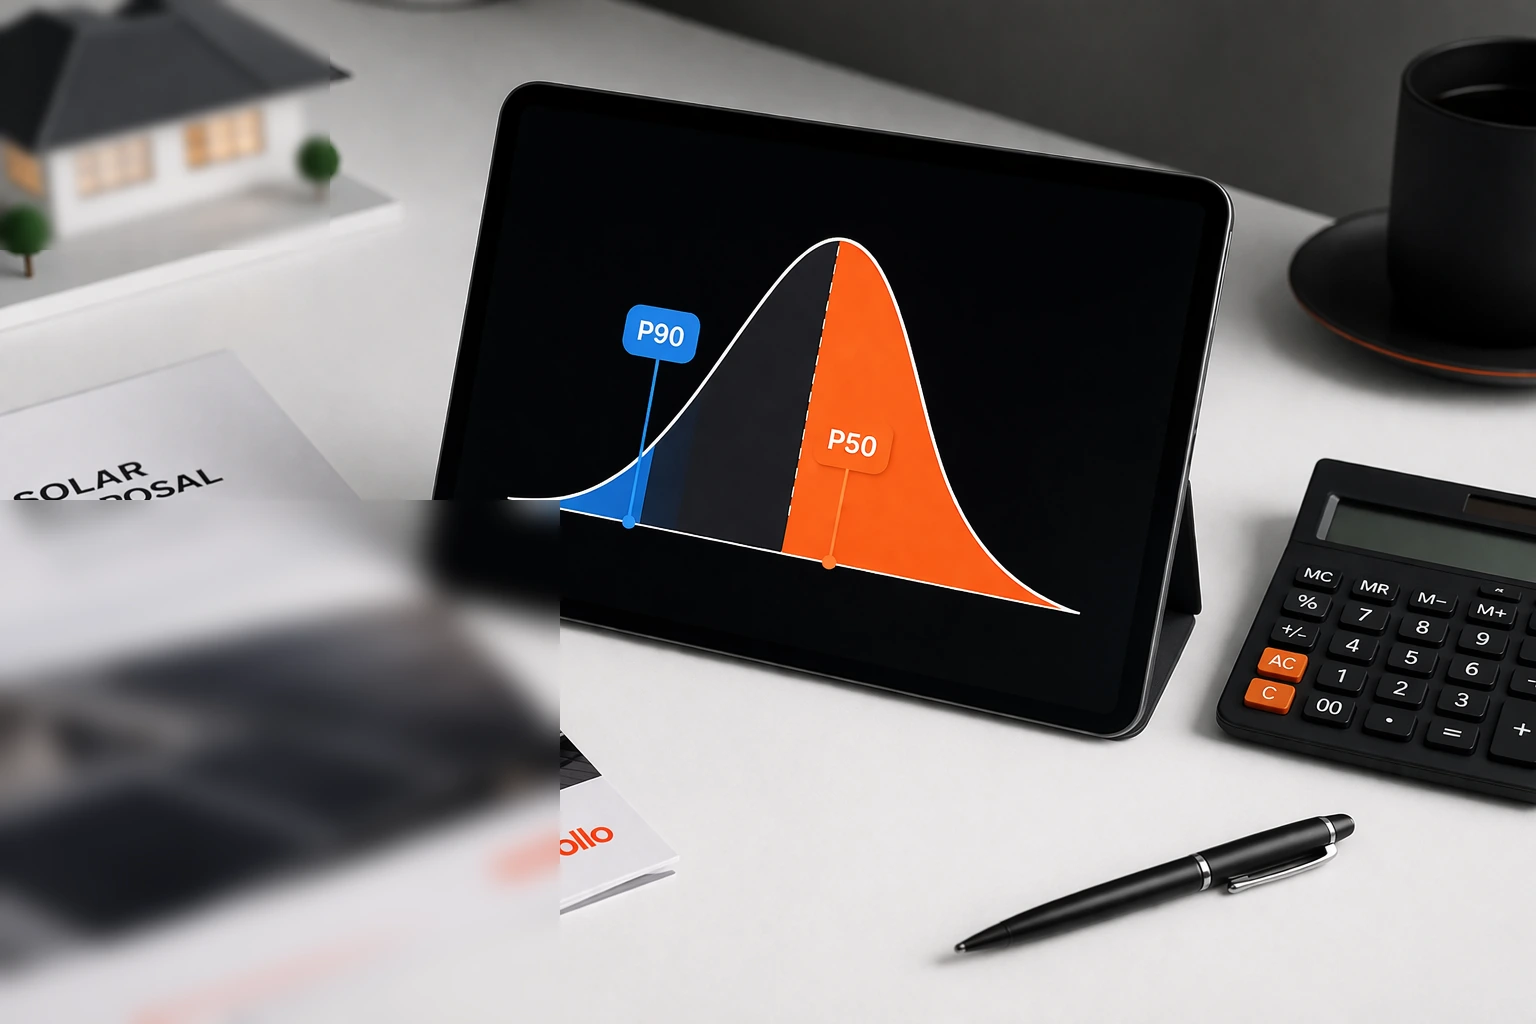
P50: The Median Estimate
P50 means there is a 50% probability that your system will produce at least that amount of energy in any given year. Think of it as the middle of the bell curve. Half the years, your system will produce more than the P50 value. Half the years, it will produce less. P50 is the "most likely" scenario, but it is not a guarantee.
P90: The Conservative Estimate
P90 means there is a 90% probability that your system will produce at least that amount of energy in any given year. This is the conservative number. Only 1 in 10 years would your system produce less than the P90 value. Banks and financial institutions use P90 for loan sizing because they need high confidence that the system will generate enough savings to cover repayments.
P75 and P99
Some proposals also reference P75 (75% probability of exceedance) and P99 (99% probability — the worst-case scenario). P75 sits between P50 and P90 and is sometimes used as a pragmatic planning figure for homeowners.
How P50 and P90 Are Calculated
These estimates are not arbitrary. They are derived from a structured process:
- Solar irradiance data collection: Software tools pull 10–20+ years of satellite-measured solar irradiance data for your specific location. For Singapore, this includes historical measurements of daily and hourly sunlight intensity, cloud cover patterns, and seasonal variation.
- System modelling: The software simulates your specific system — panel type, tilt angle, orientation, inverter efficiency, wiring losses, and shading analysis — against this historical weather data to calculate expected annual energy output.
- Uncertainty quantification: Multiple sources of uncertainty are factored in:
- Inter-annual weather variability: How much sunlight varies from year to year at your location
- Irradiance data accuracy: Satellite data has inherent measurement uncertainty
- Equipment performance variability: Real-world panel and inverter performance may differ from laboratory specifications
- Degradation: Panels lose output over time
- Modelling uncertainty: No software perfectly predicts real-world conditions
- Statistical analysis: These uncertainties are combined (typically using a normal distribution) to produce P-values. The more uncertainty, the wider the gap between P50 and P90.
The Gap Between P50 and P90: What It Means for You
For a typical residential system in Singapore, the P90 value is approximately 10–15% lower than the P50 value. Here is what that looks like in practice:
| Metric | P50 Estimate | P90 Estimate |
|---|---|---|
| Annual production (8 kWp system) | 10,400 kWh | 9,100 kWh |
| Monthly production | 867 kWh | 758 kWh |
| Annual savings (at S$0.32/kWh) | S$3,328 | S$2,912 |
| Payback period (S$18,000 system) | 5.4 years | 6.2 years |
The difference is not dramatic, but it is meaningful. If you budgeted for a 5.4-year payback based on P50 and your actual production tracks closer to P90, your payback extends by nearly a year. This does not mean the system is broken — it means you experienced a below-average weather year, which is statistically normal.
Why Year-to-Year Variation Matters in Singapore
Singapore's equatorial location provides relatively stable annual solar irradiance compared to temperate countries. However, meaningful variation still exists:
El Nino and La Nina Cycles
El Nino events bring drier, sunnier conditions to Singapore, increasing solar output. La Nina events bring more cloud cover and rainfall, reducing output. These cycles typically last 12–18 months and can shift annual solar production by 5–10% relative to the long-term average. Your system might exceed P50 during an El Nino year and fall below P50 during a La Nina year — both are perfectly normal.
Transboundary Haze
Regional forest fires (primarily in Sumatra and Kalimantan) can produce haze that reduces solar irradiance in Singapore by 15–30% during affected periods. Severe haze episodes in September and October can noticeably impact that month's production. Haze is not predictable year to year, which is one reason why the uncertainty band between P50 and P90 exists.
Monsoon Seasons
Singapore's northeast monsoon (December–March) brings more sustained cloud cover and rainfall than the drier inter-monsoon periods. Monthly solar production during the northeast monsoon is typically 15–25% lower than peak months (March–April and August–September). This seasonal pattern is accounted for in the annual P50/P90 calculations, but homeowners should expect significant month-to-month variation.
What Most Proposals Show — and What They Should Show
What you typically receive
Most residential solar proposals in Singapore show a single annual production figure — almost always the P50 value. Some present it without explicitly labelling it as P50. The proposal might simply state: "Estimated annual production: 10,400 kWh." This is not dishonest — P50 is the standard industry metric — but it creates a misleading sense of precision.
What a transparent proposal should include
- P50 and P90 annual production estimates, clearly labelled
- Monthly production breakdown showing seasonal variation
- Degradation-adjusted production showing expected output at years 1, 5, 10, and 25
- Savings calculations based on both P50 and P90, so you can see the realistic range of financial outcomes
- The software tool used for the simulation (PVsyst, HelioScope, or similar) and the irradiance dataset applied
How to Use P50 and P90 in Your Financial Planning
Here is a practical framework for incorporating these estimates into your solar purchase decision:
Step 1: Get both numbers. Ask your installer directly: "Is this yield estimate P50 or P90? Can you provide both?" If they cannot answer this question, consider it a yellow flag about their technical rigour.
Step 2: Plan your finances around a P75 figure. Calculate P75 as the midpoint between P50 and P90. This gives you a realistic planning number that accounts for normal variability without being overly conservative. For the example above: P75 would be approximately 9,750 kWh, with annual savings of roughly S$3,120.
Step 3: Evaluate payback using P90. If your payback period based on P90 savings is still acceptable (typically under 8 years for Singapore landed homes), the investment is robust even in below-average weather years.
Step 4: Judge performance over 3–5 years, not single years. Your system's 3-year rolling average should track close to P50. If it consistently falls below P90, that indicates a genuine performance issue worth investigating — possible causes include unexpected shading, equipment faults, or soiling.
Step 5: Use monitoring to track reality. Modern inverter monitoring apps show daily, monthly, and annual production. Compare your actual data to the P50/P90 range provided in your proposal. This turns abstract statistics into actionable insight.
When P50/P90 Analysis Does Not Apply
P50/P90 methodology was developed for utility-scale solar projects with large datasets and sophisticated financial modelling. For residential systems in Singapore, a few caveats apply:
- Shading changes: P50/P90 models assume a static shading environment. If a neighbour builds a new storey or a tree grows taller, your actual production may fall below even P90. Regular shading assessments matter.
- Equipment changes: If you replace your inverter or add panels, your original P50/P90 estimates no longer apply. Request updated modelling.
- Consumption pattern changes: P50/P90 predict production, not savings. Your savings also depend on how much solar energy you self-consume versus export. Changes in your household's consumption pattern (working from home, adding an EV, growing family) affect savings independently of production.
Frequently Asked Questions
Should I always ask for P90 instead of P50?
Ask for both. P50 tells you the most likely outcome. P90 tells you the conservative floor. Together, they give you the realistic range. Base your "expected" outcome on something between the two.
If my system produces more than P50, does that mean it is overperforming?
Not necessarily. By definition, you should exceed P50 in roughly half of all years. Exceeding P50 means you had a good weather year or your system is operating efficiently. It is normal and expected.
My system produced 20% below P50 last year. Is something wrong?
Possibly. A 20% shortfall is larger than typical year-to-year variation (which is usually plus or minus 10–15%). Check your monitoring data for anomalies: sudden drops in daily production, individual panel underperformance, or inverter error codes. If the decline was gradual and coincided with a particularly cloudy or haze-heavy period, weather may be the primary factor.
Do all solar installers in Singapore provide P50/P90 estimates?
Not all. Many residential installers provide only a single production estimate (typically P50) without labelling it. Premium installers with engineering-grade tools like PVsyst or HelioScope can provide detailed P50/P90 analysis. The ability to provide these figures is itself a quality indicator.
Understanding P50 and P90 transforms you from a passive buyer accepting a single number into an informed decision-maker who understands the range of realistic outcomes. For more on how proposal promises compare to real-world performance, read our guide on solar production reality vs. simulation or explore the full 15 Solar Myths guide.